I wanted to experiment the difficulty of reusing cyclOSM layers to render vector tiles.
My goal was to visualise the cycling infrastructure on a map (tracks, lanes, shared lanes, etc.) as well as parkings. This would allow me to reproduce the Geovelo rendering which I love.
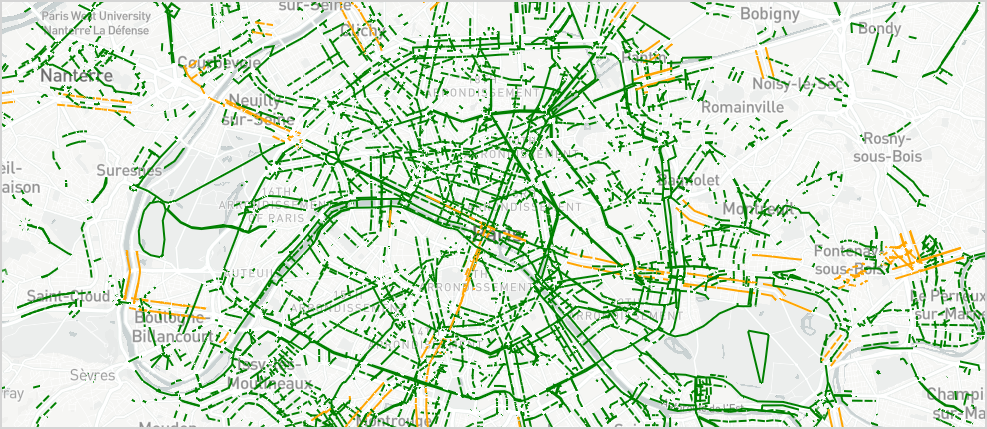
CyclOSM is a bicycle-oriented map built on top of OpenStreetMap data. It aims at providing a beautiful and practical map for cyclists, no matter their cycling habits or abilities.
At low-level zoom, only bicycle infrastructure is visible:
-
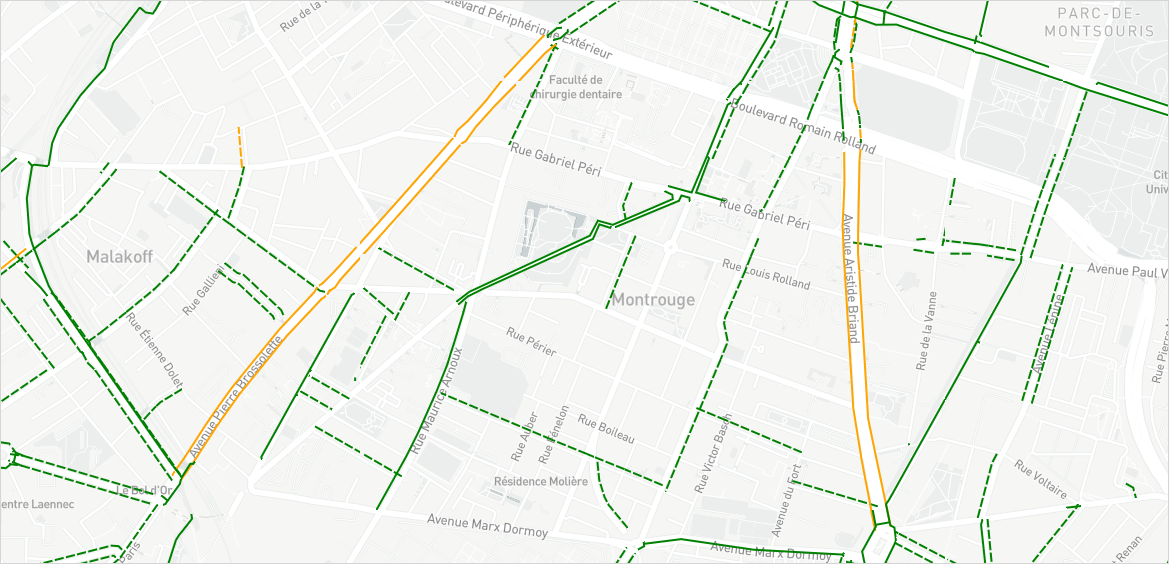
Filled lines displays dedicated infrastructure (such as tracks or cycleways)
-
Dashed lines are shared infrastructure (such as lanes or shared bus ways)
-
Green color is for permanent infrastructure
-
Orange color is for temporary infrastructure (aka post-lockdown cycleways)
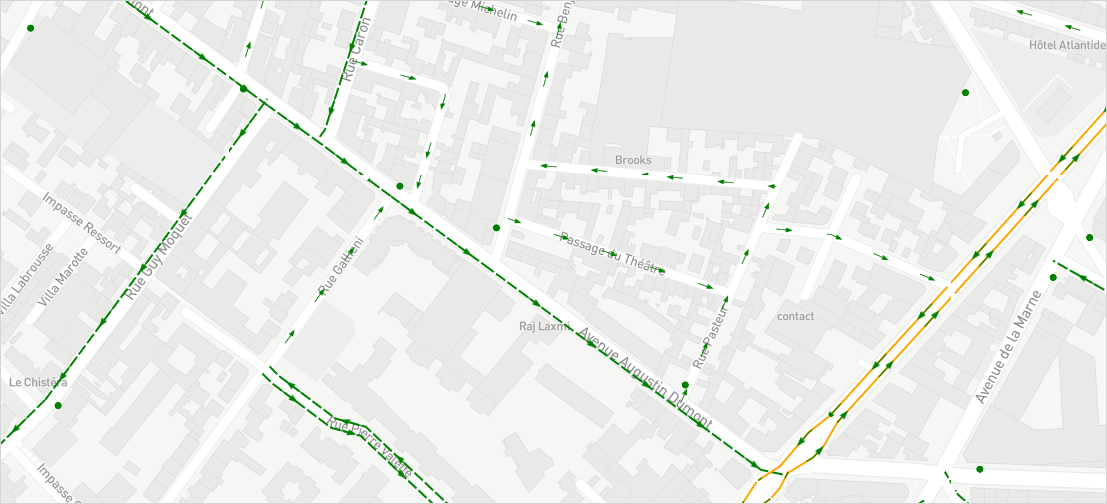
Starting at zoom 15 a few details appears:
-
Arrows that display the direction
-
Arrows on roads with the opposite side usable for cyclists
-
Bicycle parking as a circle
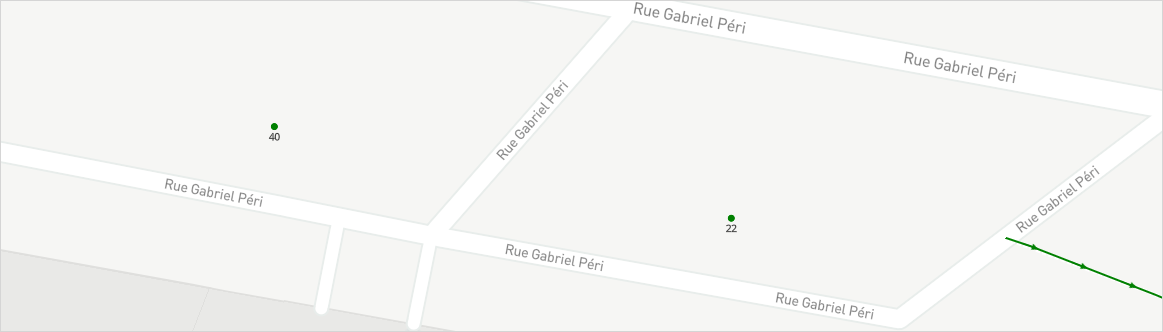
Then starting at zoom 17, the capacity of the bicycle parking is displayed.
That’s all for this experiment! The result can be seen here: cyclosm.2metz.fr/static/index.html (Ile-de-France, France only).
The code is available on the vector branch of my fork. The vector tile server used is t-rex.
You are interested expanding the coverage or adding features? Feel free to contact me.